
Bitcoin is priced at $9,703.00 at the time of writing, following a 4 percent rise on the day. The remaining rebound is limited at $10,000 psychological, which is within range as BTC/USD bulls regain traction upward. Bitcoin price a few days after the process of halving is steadily bullish. This barrier prevents BTC from transition to $10,500. Once the recovery is completed, price intensity may commence. Whenever the digital currency may have executed the one-in-four year adjustment called halving, retail investors may revert to Bitcoin yet again. Some analysts think that halving may render Bitcoin less valuable to miners. Premised on the past, though, there may be a bull run after a post-halving drop in price. For example, the 2016 halving prompted a 300 percent Bitcoin value spike.
*The remaining rebound is limited at $10,000 psychological, which is within range as BTC/USD bulls regain traction upward
*Bitcoin price a few days after the process of halving is steadily bullish
*Premised on the past, though, there may be a bull run after a post-halving drop in price
Key Levels
Resistance Levels: $10,000, $9,500, $9,000
Support Levels: $9,000, $8,500, $8,000
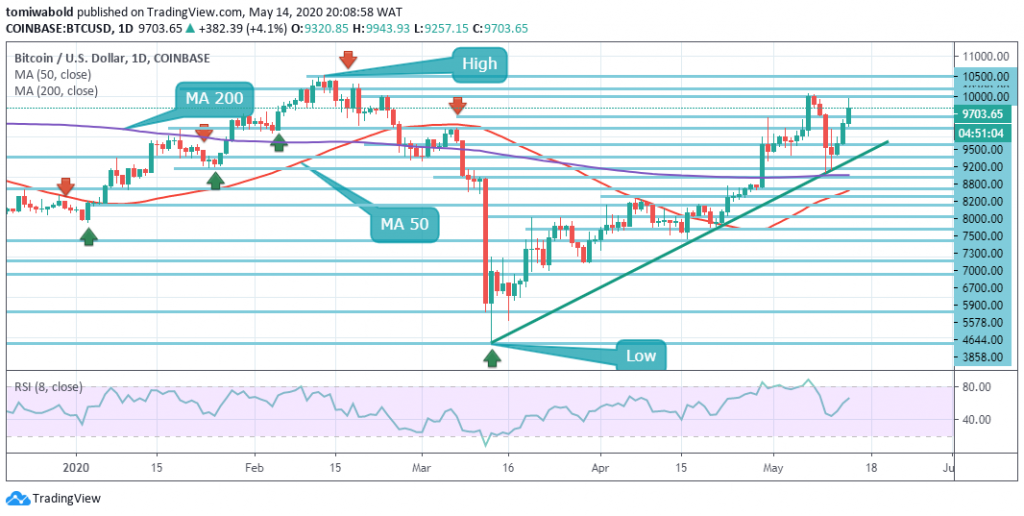 BTC/USD Daily Chart
There are critical moments in the context of technical analysis, as with everything else, and Bitcoin is at those moments. Bitcoin is primed for the further activity to the north because the RSI does have overbought conditions at bay. If $10,000 isn’t breached shortly a reversal may occur. In this scenario, support is anticipated at levels of $9,500, $9,200, and $8,800.
The trend is in the bulls’ clutches as of now, while the MA 50 reduces the range to the MA 200 near as possible. It’s not certain whether the impact of halving has finally emerged and the farther the momentum may go. Whatever the scenario, particularly after the catastrophic unrestricted-fall to $8,100 last week, the rebound indeed is a pleasant sight. Bitcoin is currently trading at $9,703, following a minor intraday relatively weak shift.
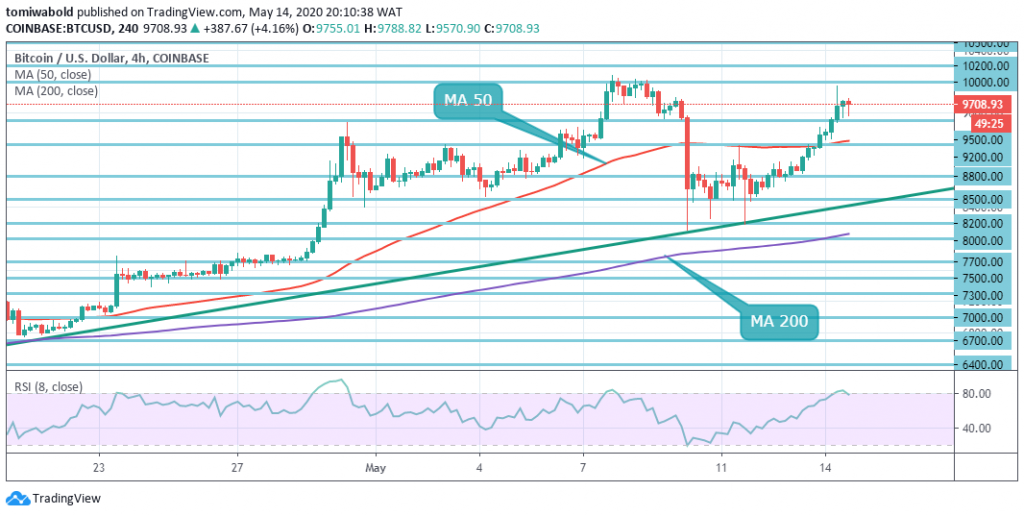 BTC/USD 4-Hour Chart
In the short term, Bitcoin increasingly looks bullish as the number one cryptocurrency continues rallying beyond the level of $9,500. BTC/USD bulls may reach the resistance level of $10,000 once they can manage to maintain prices beyond the near-term support level of $9,500. BTC/USD bulls could reach for a resistance level of mid-$11,000 once they manage to force a relentless attack well above the resistance level of $10,000.
The BTC/USD pair is only bullish when moving beyond the level of $9,200, the main resistance is seen at levels between $10,000 and $10,500. When the BTC/USD pair trades beneath $9,200 level, sellers may test the support levels of $8,800 and $8,200. Out of this analysis, we may derive the foregoing observations: The amount of trading increased exponentially together with the price, which further reflects in support of further progress.
Note: Kryptomoney.com is not a financial advisor. Do your research before investing your funds in any financial asset or presented product or event. We are not responsible for your investing results
Image Credit: Shutterstock


Keep in mind that we may receive commissions when you click our links and make purchases. However, this does not impact our reviews and comparisons. We try our best to keep things fair and balanced, in order to help you make the best choice for you.
