
Chainlink is among the Week’s best-performing Altcoins. The token’s price bottomed on Monday, May 15 at $3.64, and reached $4.24 on Thursday. During the recent crypto-market price reversal, dip-buyers utilized the pullbacks as upside prevails on LINK for the 3rd day in a row. LINK/USD exchanges at $4.18 at the time of posting, rising over 3.0 percent daily. LINK is the 13th largest digital asset with an estimated daily trading volume of $315 million and its total market cap of $1.46 billion. Chainlink is among 100 startups recognized as the 2020 ‘technology pioneers’ by the World Economic Forum (WEF). The WEF has recognized Chainlink as a leading provider and innovator of emerging technologies. Premised on this recognition, Chainlink will be able to introduce its technology to influential globe-wide conferences and promote transformations in various sectors.
*During the recent crypto-market price reversal, dip-buyers utilized the pullbacks as upside prevails on LINK for the 3rd day in a row.
*LINK/USD exchanges at $4.18 at the time of posting, rising over 3.0 percent daily
*Chainlink is among 100 startups recognized as the 2020 ‘technology pioneers’ by the World Economic Forum ( WEF)
Key Levels
Resistance Levels: $5.5, $5.00, $4.50
Support Levels: $4.00, $3.66, $3.00
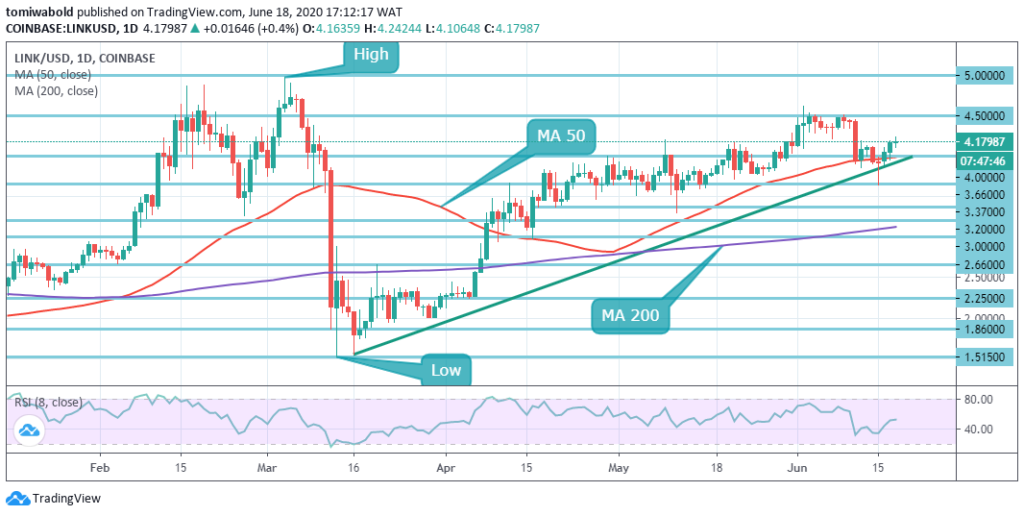 LINK/USD Daily Chart
The price has bounced off the rising MA 50 on the daily chart and now price is trading at $4.18. Once the progress invades higher, the rebound may stretch to the horizontal resistance zone of $4.50. The prior rebound high provides this resistance and divides the token from a larger upward shift toward psychological $5.00. The latest news acted as a LINK bull catalyst and set the rally in motion.
The initial support lies downside right at $4.00. It is supported by daily MA 50 and the ascending trendline. A successful push beneath this region may pave the way to the $3.00 psychological level in which new buying activity is likely to emerge. Growth of LINK is accompanied by high volumes, adding credibility to the upside trend.
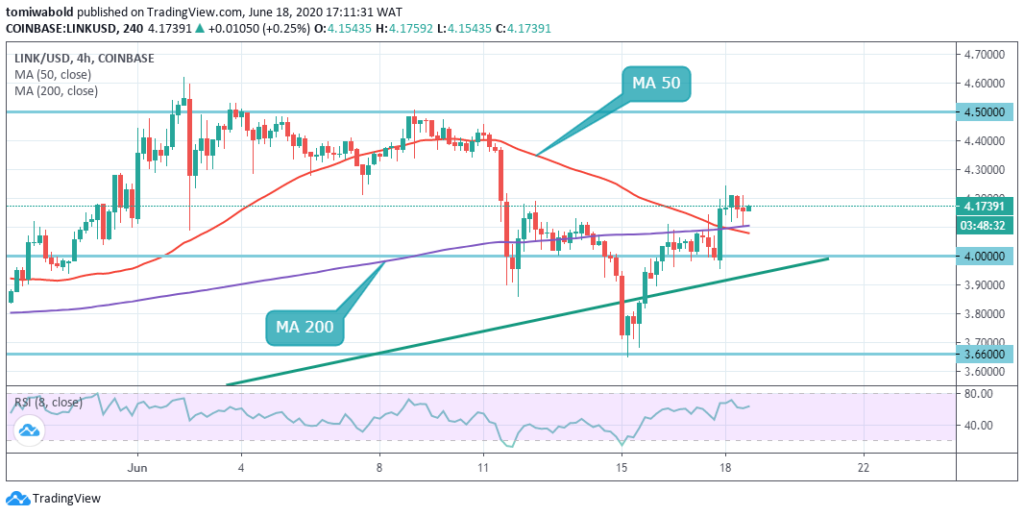 LINK/USD 4-Hour Chart
On 15 June Chainlink (LINK) broke down the ascending trendline support. This bearish breakout target is the $3.66 horizontal support line, where it rebounded beyond $4.00 level. The four-hour chart shows the bulls are heading back to the higher levels to hold on. Although a crossover has been resolved by the moving averages, the RSI has however staged a rebound into the positive region, which implies that the upside has regained traction.
This may signal a potential continuation of the uptrend if the rebound grows towards the $4.5. A rally to $4.5, and then $5.0, will be the initial aim. If the bears plunge the LINK/USD pair beneath the ascending trendline, this bullish position is nullified. A breach of the $4.0 key support would be a negative sign signaling a potential trend shift from bullish to range-bound.
Note: Kryptomoney.com is not a financial advisor. Do your research before investing your funds in any financial asset or presented product or event. We are not responsible for your investing results
Image Credit: Shutterstock


Keep in mind that we may receive commissions when you click our links and make purchases. However, this does not impact our reviews and comparisons. We try our best to keep things fair and balanced, in order to help you make the best choice for you.
